
Percentage of Divorced Population in the Hudson Valley by Town
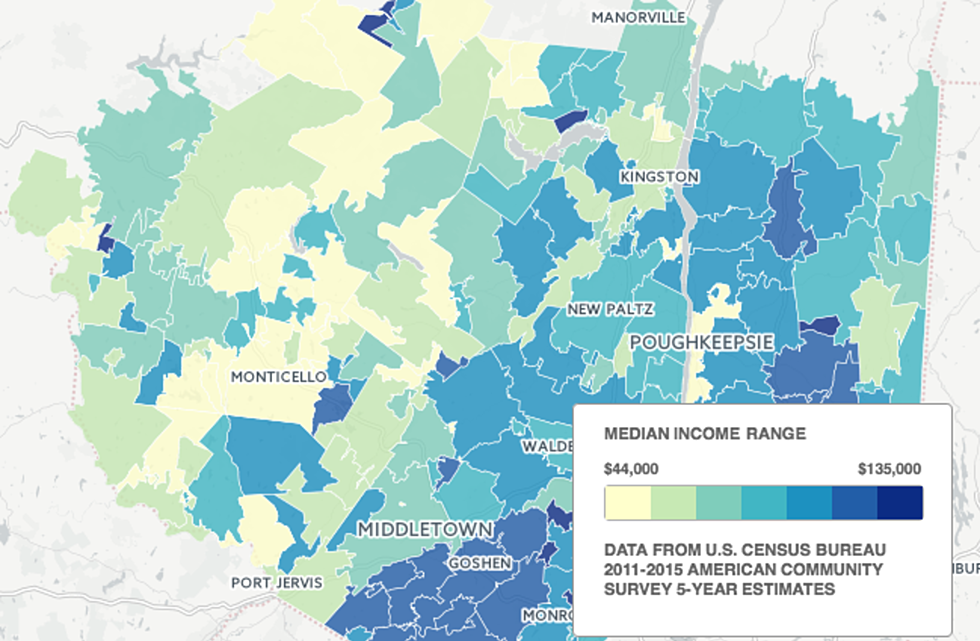
Our Hudson Valley data map of the percentage of the divorced population in the Hudson Valley by town uses information from the U.S. Census Bureau's 2011-2015 American Community Survey 5-Year Estimates.
The American Community Survey is the largest household survey in the country. These survey results assess a variety of economic and demographic information about the country.
The results of 40 information topics explored in the survey were broken down by state, county and zip code in the latest five-year estimates, which were released on Dec. 8, 2016.
You can view the percentage of the divorced populace for 2011-2015 by municipality through the Hudson Valley data map below. The percentage is based on the population of individuals age 15 years and older who defined their marital status in the survey as "divorced."
Having trouble viewing? Open the map in a new browser.
We look forward to bringing you more ways to explore the Hudson Valley's economic, demographic and social data made publicly available from government and university studies and surveys.
Subscribe to the Hudson Valley Post's newsletter and follow us on Facebook to be alerted when more data maps are published.
More From 97.7/97.3 The Wolf