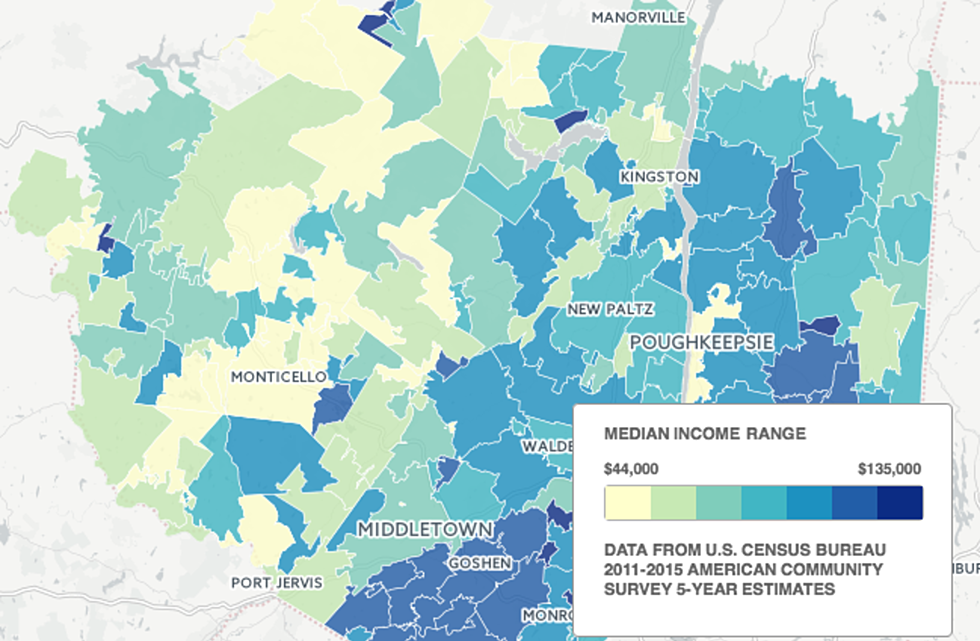

Hudson Valley Median Household Income by Town
Our Hudson Valley median income data map uses information from the U.S. Census Bureau's 2011-2015 American Community Survey 5-Year Estimates.
The American Community Survey is the largest household survey in the country. These survey results assess a variety of economic and demographic information about the country.
The results of 40 information topics explored in the survey were broken down by state, county and zip code in the latest five-year estimates, which were released on Dec. 8, 2016.
You can view the median 12-month household income for 2011-2015 by municipality through the Hudson Valley data map below. Median household income is defined as the number exactly in the middle of a set of data. That means half the households in the town make above the listed salary and half make below it.
We look forward to bringing you more ways to explore the Hudson Valley's economic, demographic and social data made publicly available from government and university studies and surveys.
Subscribe to the Hudson Valley Post's newsletter and follow us on Facebook to be alerted when more data maps are published.
More From WZAD-WCZX The Wolf